Debugging a Jaeger memory issue
At Auto Trader UK we use Jaeger as the distributed tracing component within our Istio based service mesh to collect & visualise HTTP request traces for the services we run on our Delivery Platform (using GKE).
We have around 400 services running in production and distributed tracing provides a lot of value for us when debugging problems and understanding behaviour across the system.
At a high level, Jaeger consists of the following components:
agent- listens for spans sent over UDP, batches them and sends to thecollectorcollector- receives traces fromagentsand runs them through a processing pipeline. Ultimately thecollectoris responsible for storing traces in some form of backendstorage.query- retrieves traces from storage to display in the frontend/UIfrontend(UI) - used to query and visualise traces for end usersstorage- pluggable storage component in which thecollectorwill persist spans, in our case Elasticsearch
The following diagram illustrates the flow of trace spans through Jaeger.
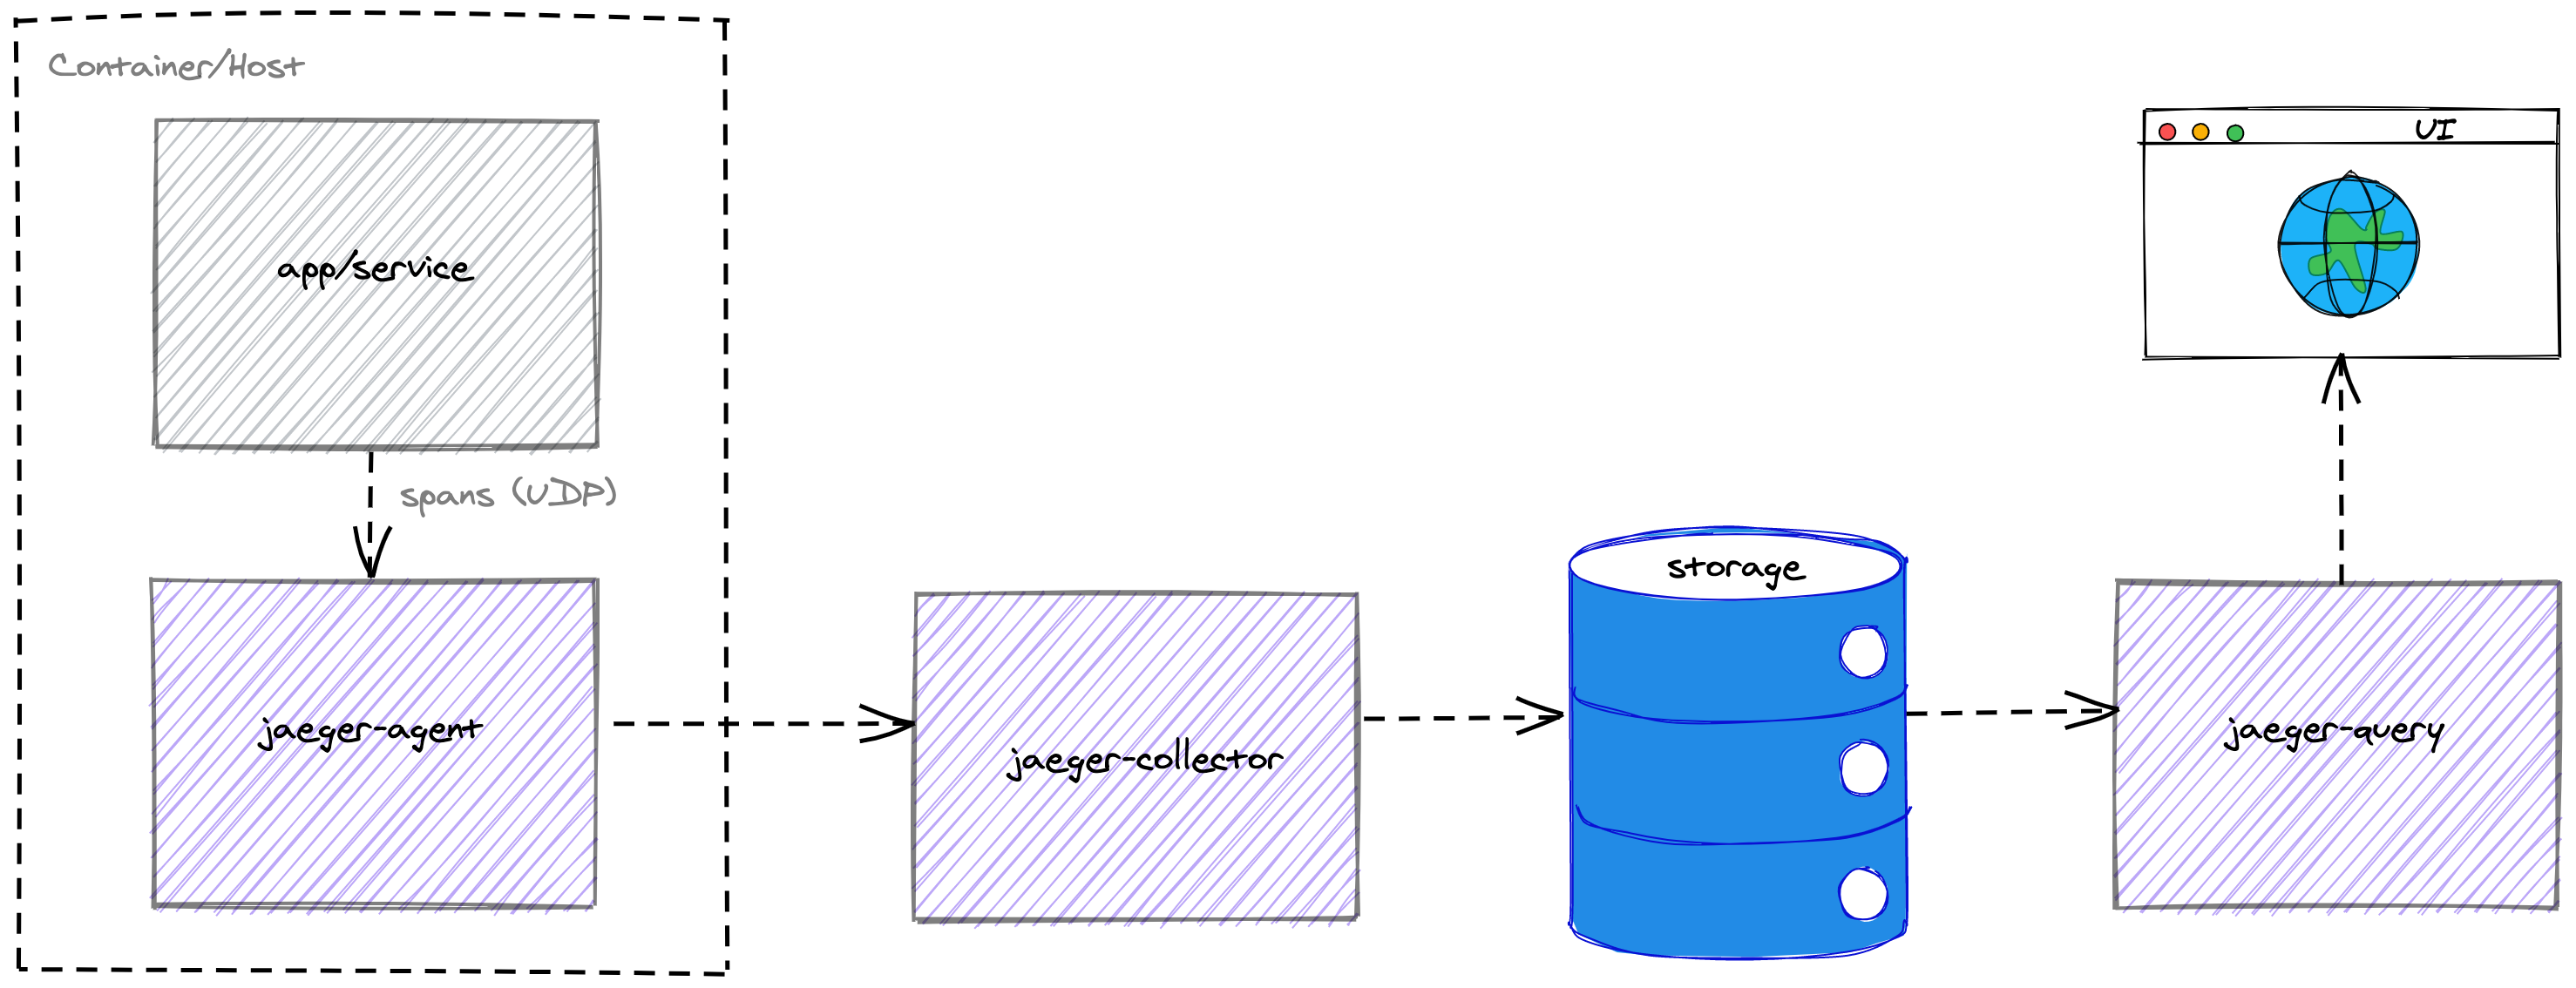
The Jaeger docs provide more detail of its architecture.
As mentioned previously, we operate Istio on the cluster and this is the source of request traces on the platform. Every HTTP request to a service running on the cluster is ingressed via an ingress-nginx edge proxy at which point a trace for that request begins. A trace span is generated for every connection between the Istio side-car proxies (i.e. Envoy proxies) deployed alongside every pod (i.e. replica/instance) for a service. The proxies transparently intercept, augment and route HTTP based traffic between services across the cluster.
Istio offers much more than just this but for the purposes of this post we are only interested in tracing.
The problem⌗
With this context let’s describe the problem we experienced with the collector.
We were alerted (via a Prometheus alert rule) to the fact that the container for the collector had crashed and been restarted.
With some basic debugging, using kubectl get pods --watch, we were able to observe the pod’s state changes which highlighted that it had been OOMKilled.
NAME                                READY   STATUS             RESTARTS   AGE
jaeger-collector-6fdf6bf6bb-qp84z   1/1     Running            5          109m
jaeger-collector-6fdf6bf6bb-qp84z   0/1     OOMKilled          5          111m
jaeger-collector-6fdf6bf6bb-qp84z   0/1     CrashLoopBackOff   5          111m
OOMKilled is a pod state that indicates that the Linux out-of-memory (OOM) killer has terminated a container process in the pod. This happens when a pod consumes more memory than its limit.
You can find a detailed explanation of how resources are managed on Kubernetes in the docs.
This was confirmed further using a simple Prometheus query based on the kube_pod_container_status_terminated_reason metric.
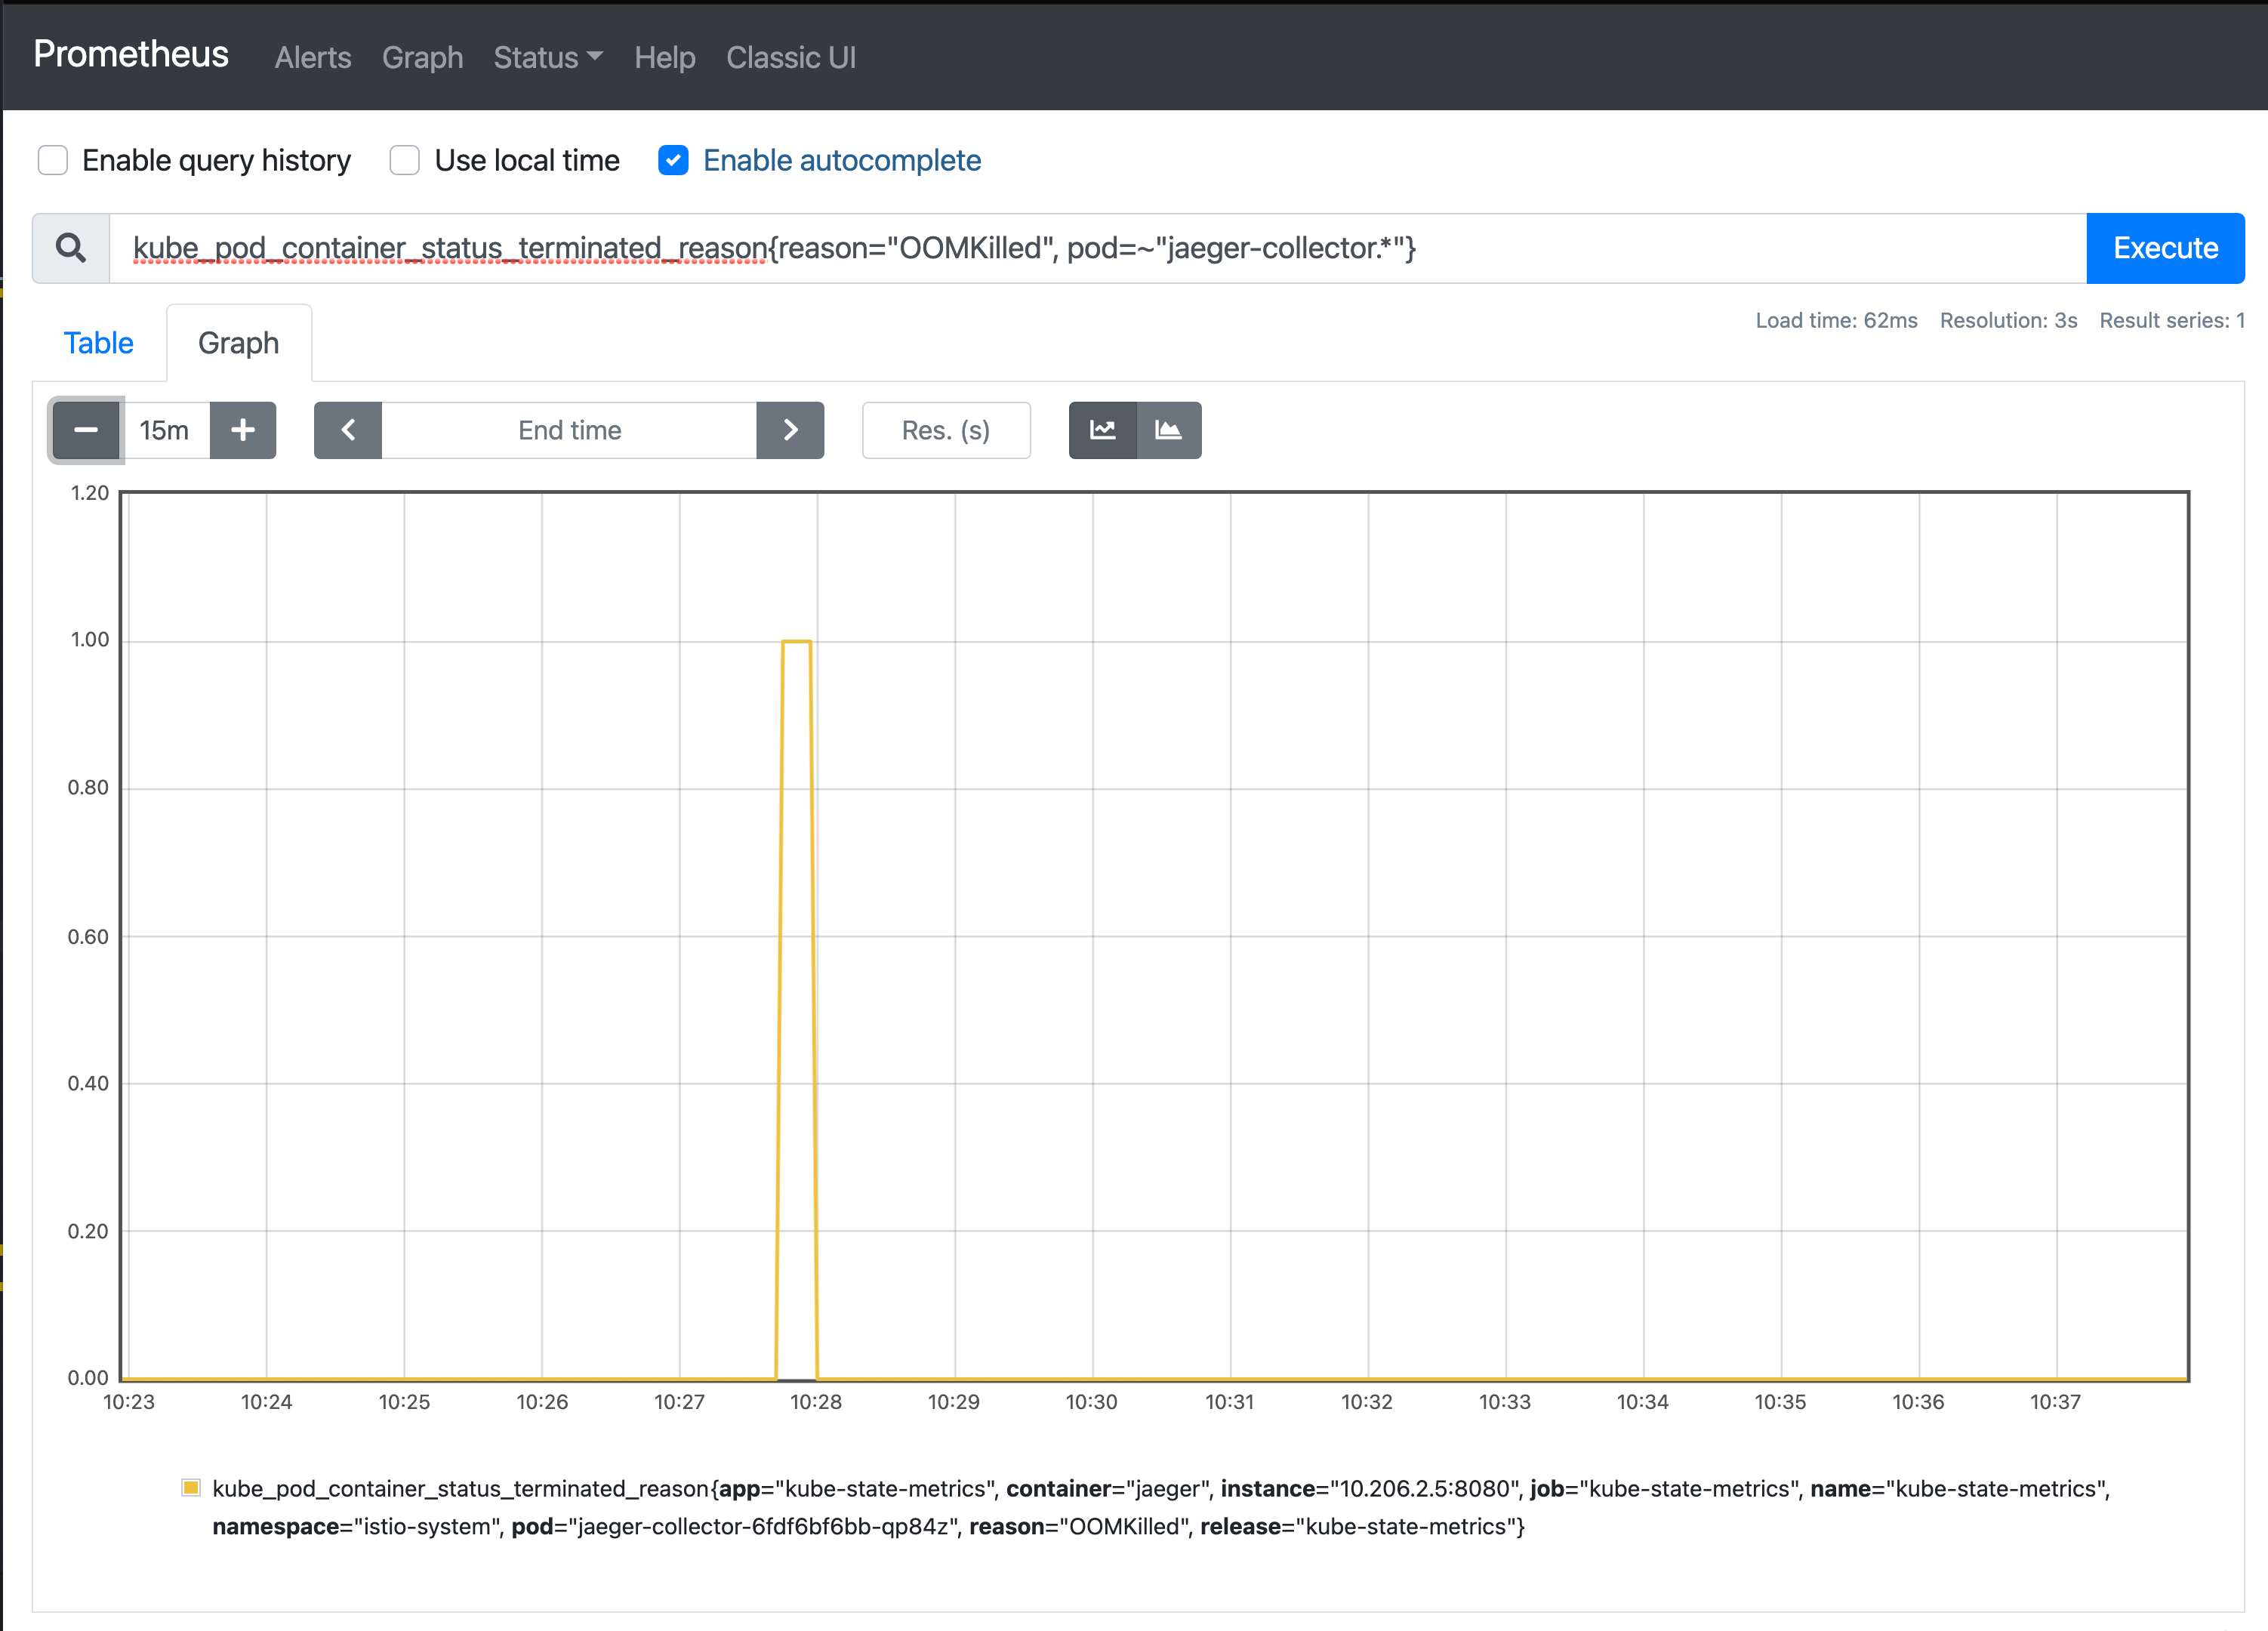
Around the same time we’d been performing some Elasticsearch (Jaeger’s storage backend) upgrades and this gave us a correrlation point that warranted further investigation.
We discovered that during an Elasticsearch upgrade we were experiencing some unplanned downtime.
The unavailability of Elasticsearch meant that the collector was unable to send its trace events to the storgae backend.
In theory, this shouldn’t be a problem for the collector.
Under normal conditions we expect the collector’s queue to be near empty at all times.
This shows us that we are able to store trace spans at a fast enough rate to keep up with the volume of spans being generated across the system.
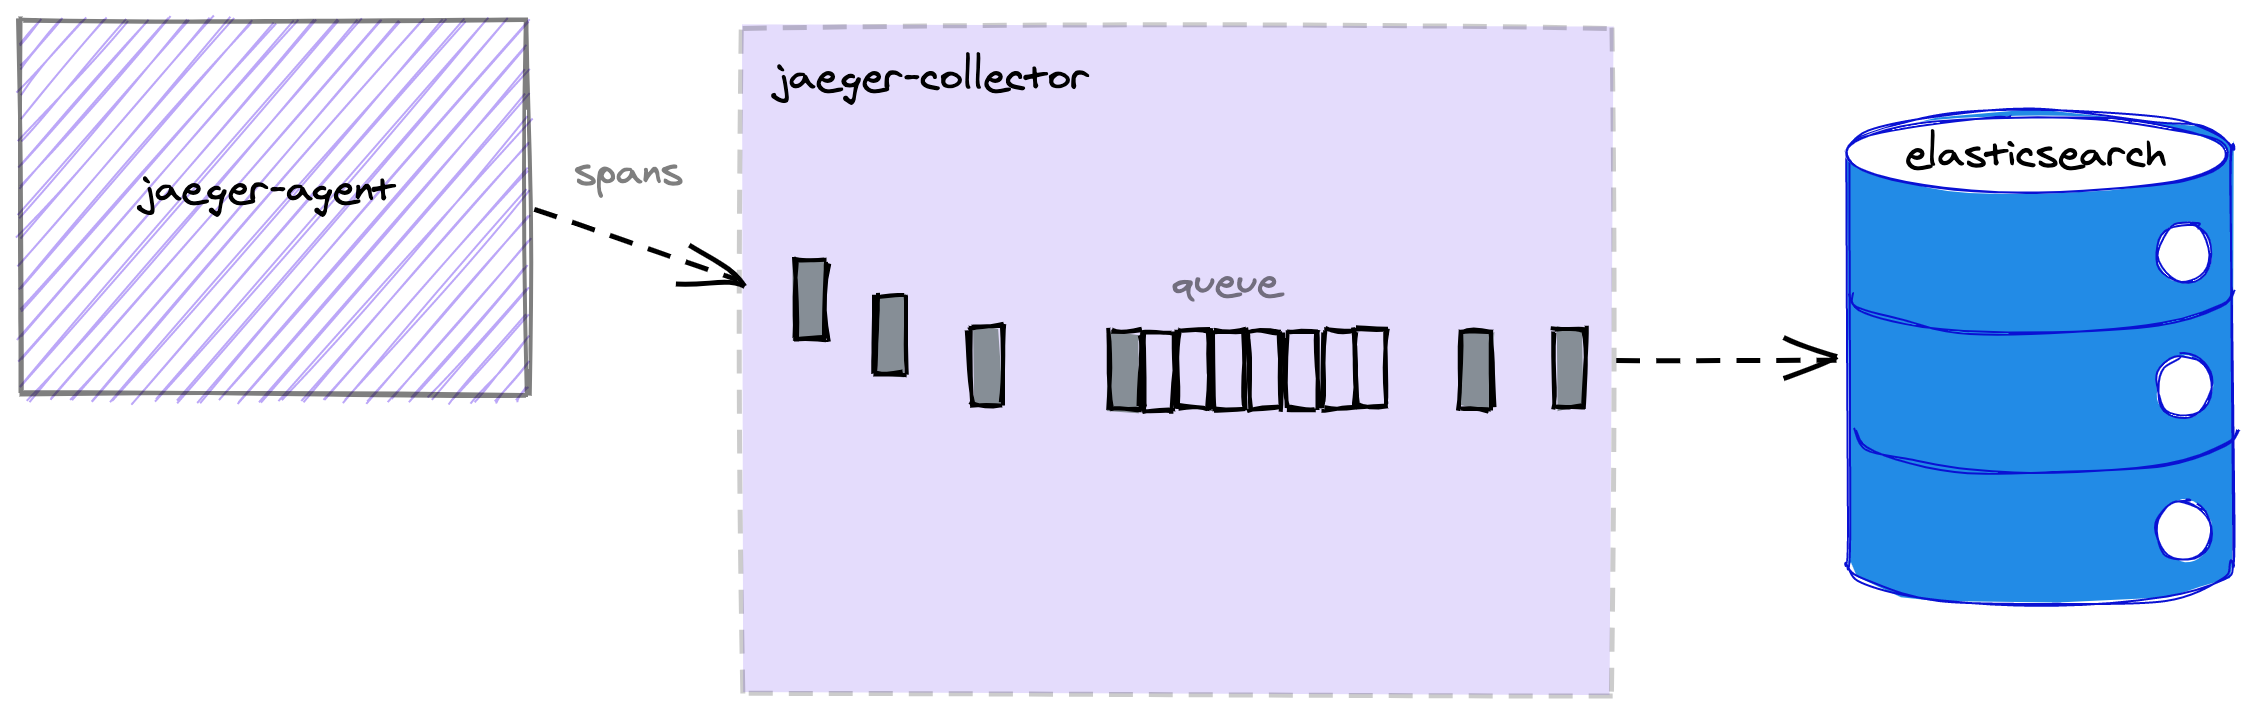
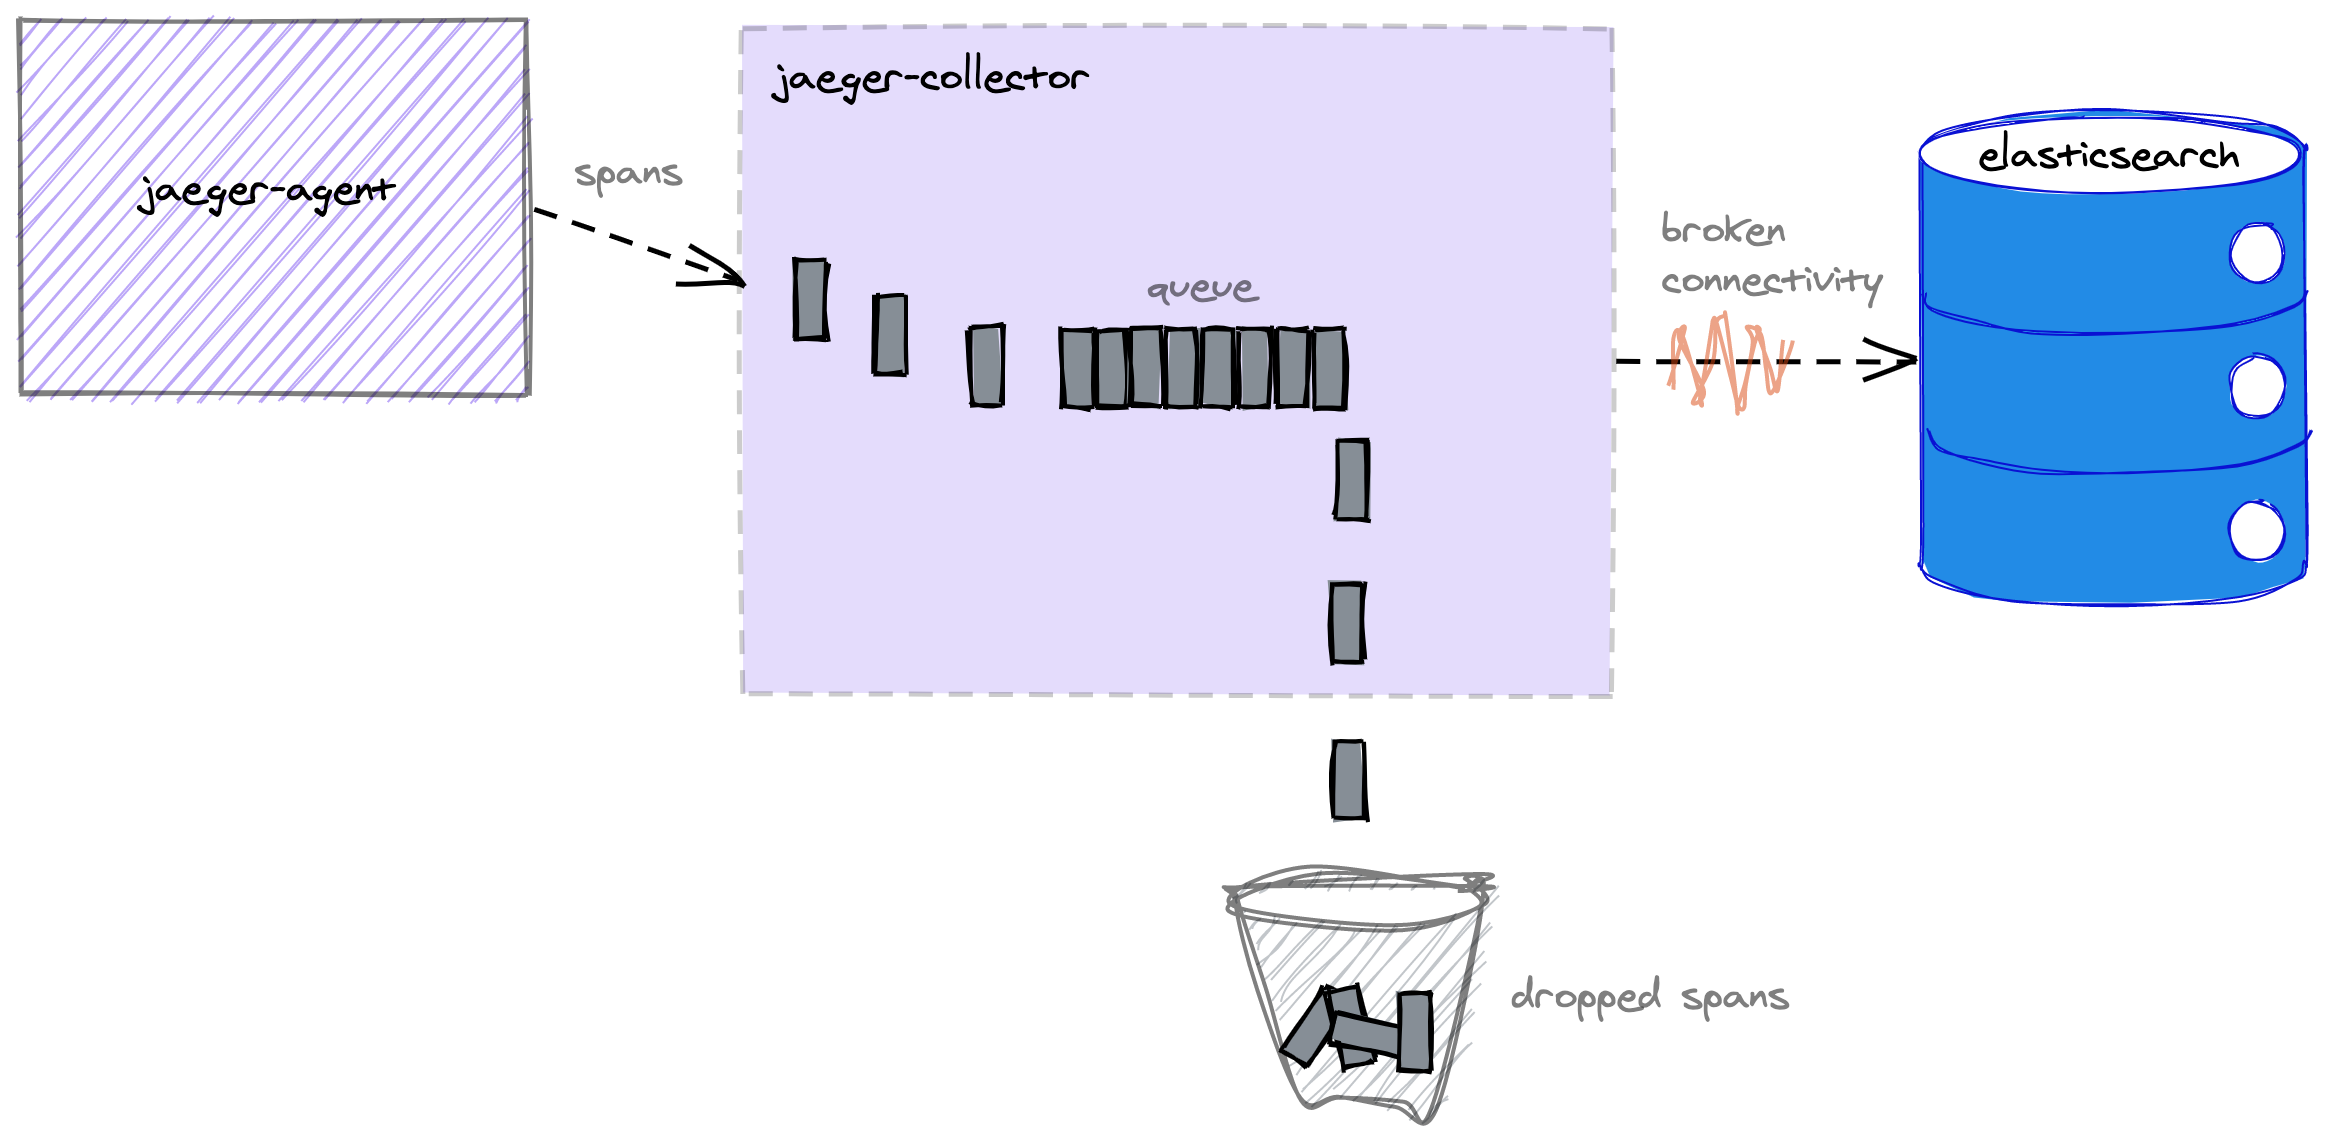
The collector is designed to handle the unavailability of the storage backend using an internal bounded queue that buffers trace spans when it is unable to store them.
If the queue fills up then the collector will drop the oldest trace spans and should continue working in this way until it is able to store spans again.
The following configuration options can be used to control the size of the collector’s queue:
collector.queue-size- limits the queue size by an absolute maximum number
- e.g. 50,000 spans
collector.queue-size-memory- limits the queue size based on a calculation involving an amount of memory and the average span size, calculated at runtime
- e.g. 80 megabytes
In principal, the collector.queue-size-memory option sounds great and we decided to go with it as it allowed us to control the resources that instances of the collector would use regardless of the size and volume of trace spans.
So when we understood that the collector container restarts correlated with their queue filling up due to the unavailability of the storage backend, it challenged our expectations of how the collector should behave in this scenario.
The actual memory usage did not appear to align with how we had configured the Jaeger collector, which was to have a maximum queue size of 80mb and an overall memory request for the container of 200mb.
With our set up, the collector utilises around 10% of the available 200mb request when it is managing its queue effectively.
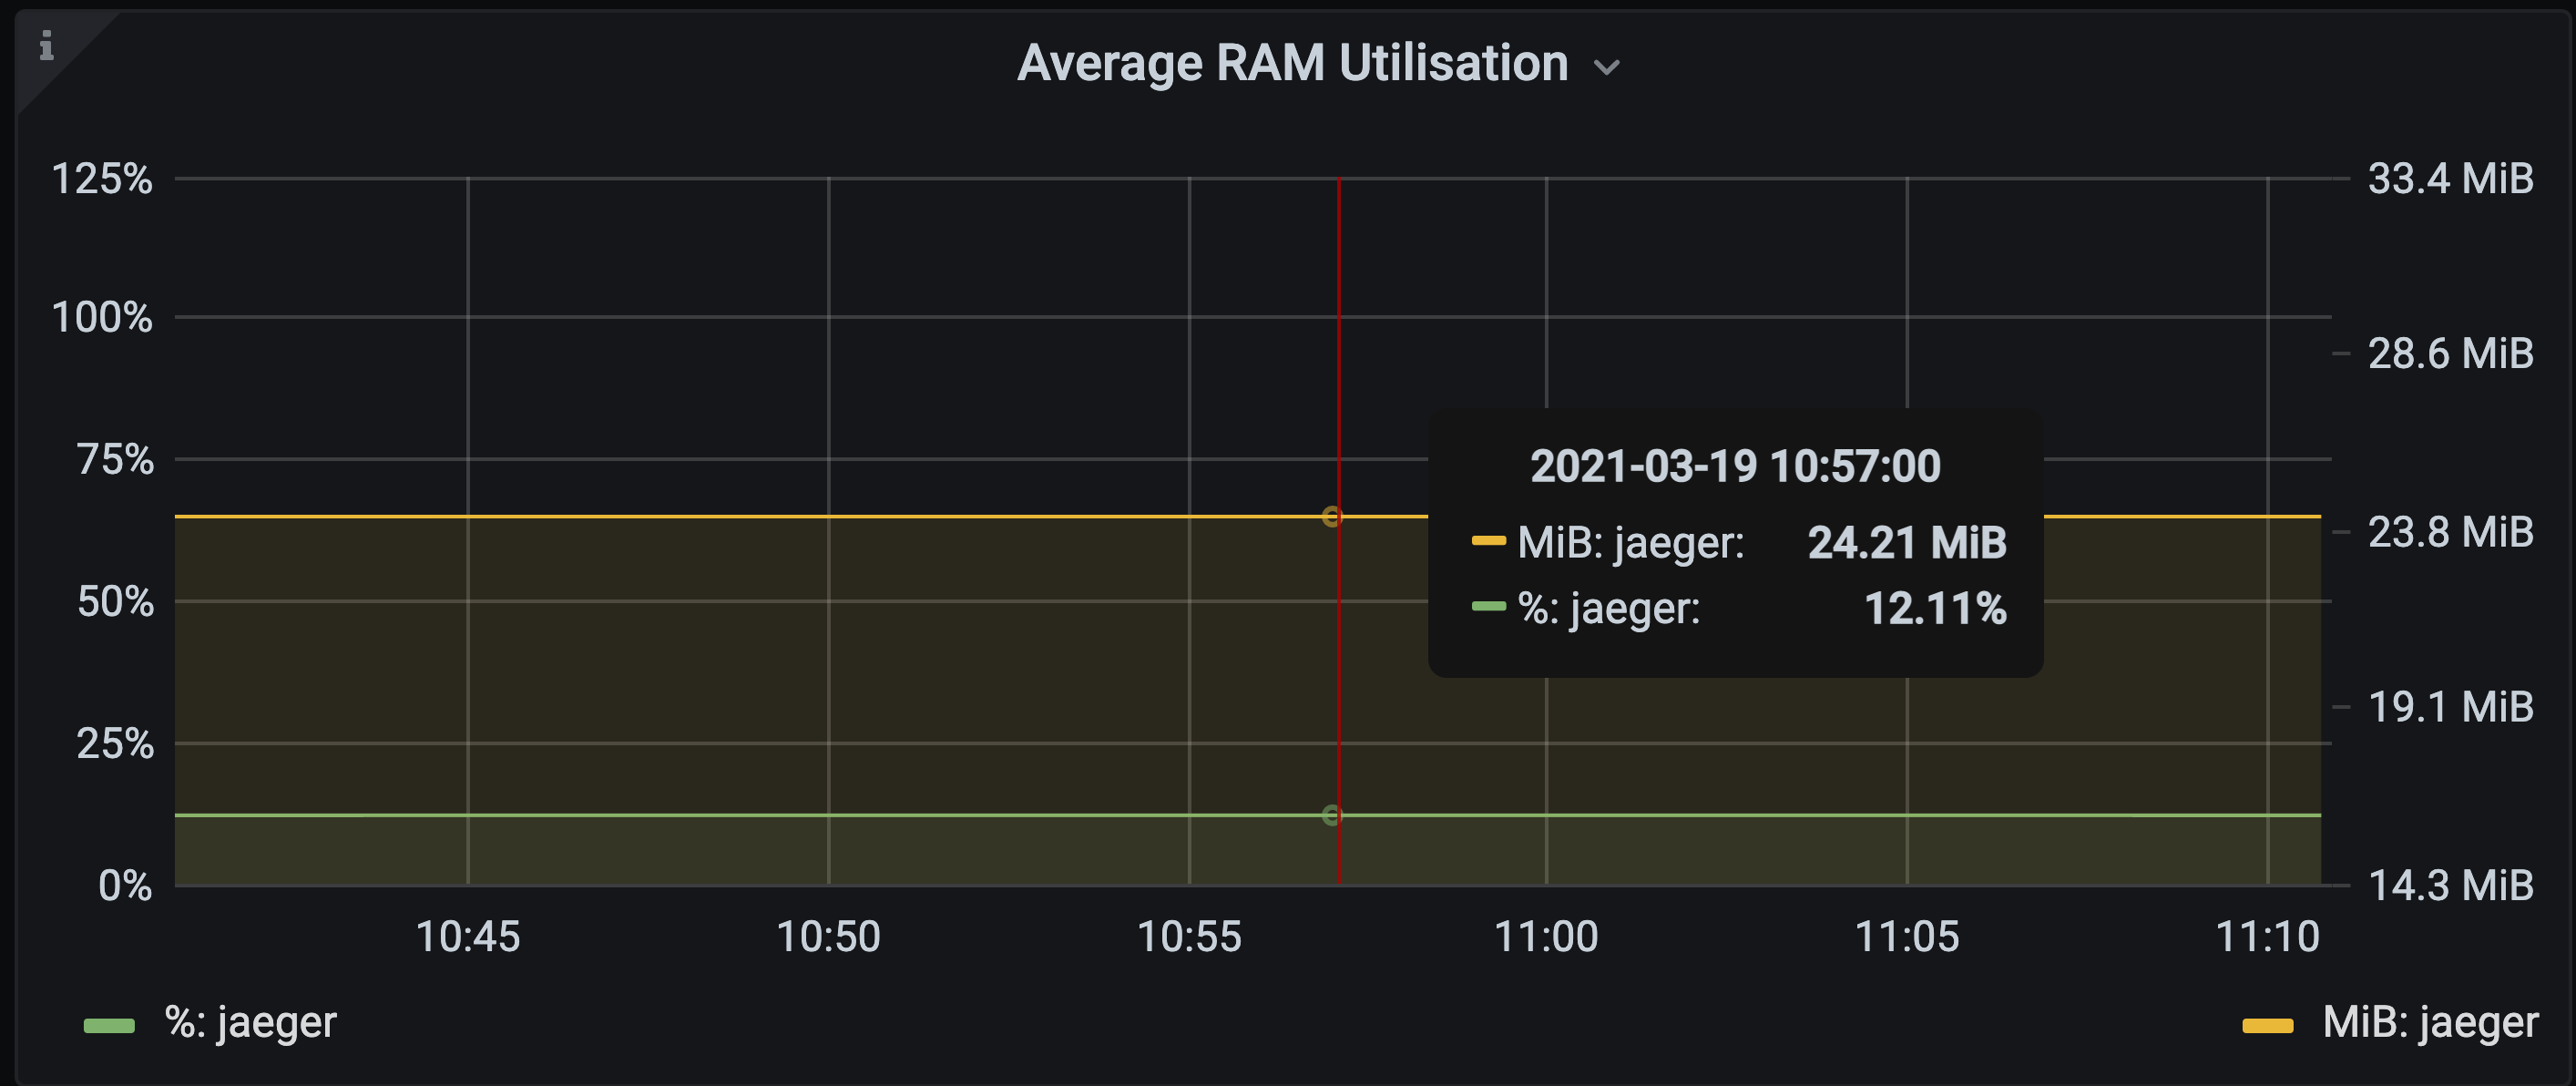
We expected that when the collector queue filled up then memory usage would be constrained to the value we configure it for, and for trace spans to be dropped when the queue was full.
What actually happened was that before we were able to observe trace spans being dropped to a full queue the OOM killer had already done its job.
In theory, the max queue size setting of 80mb should constrain the queue and the amount of memory it consumed.
This, combined with the overall memory request of 200mb, should provide ample space for the the collector to be resilient to any scenario that could cause the queue to fill up with memory to spare for the general overheads of the collector process.
Investigation & understanding⌗
A good first step when investigating an issue is to try to recreate it. This can often be easier said than done.
The reality is that it took several attempts (seperated by a number of nights sleep) to fully understand what was actually happening when the collector was unable to store trace spans due to Elasticsearch being unavailable.
At Auto Trader we deploy the Delivery Platform to a testing cluster on GKE which is an exact replica of production from a platform perspective. The only real differences are the scale (e.g. the resources we make available to the cluster) and the product related workloads that are deployed; the infrastructure and platform services are equivalent.
We also deploy some test services to all environments that serve the purpose of continually verifying that our Istio deployment is behaving as expected by simulating the behaviours we depend on, for example, distributed tracing via Jaeger.
This made it relatively straighforward to simulate the issue in a non-production environment as Jaeger was already deployed along with the test services.
All I needed to do was generate some load that would produce a reasonable volume of trace spans across the system and then break connectivity with Elasticsearch to cause the collector queue to fill up.
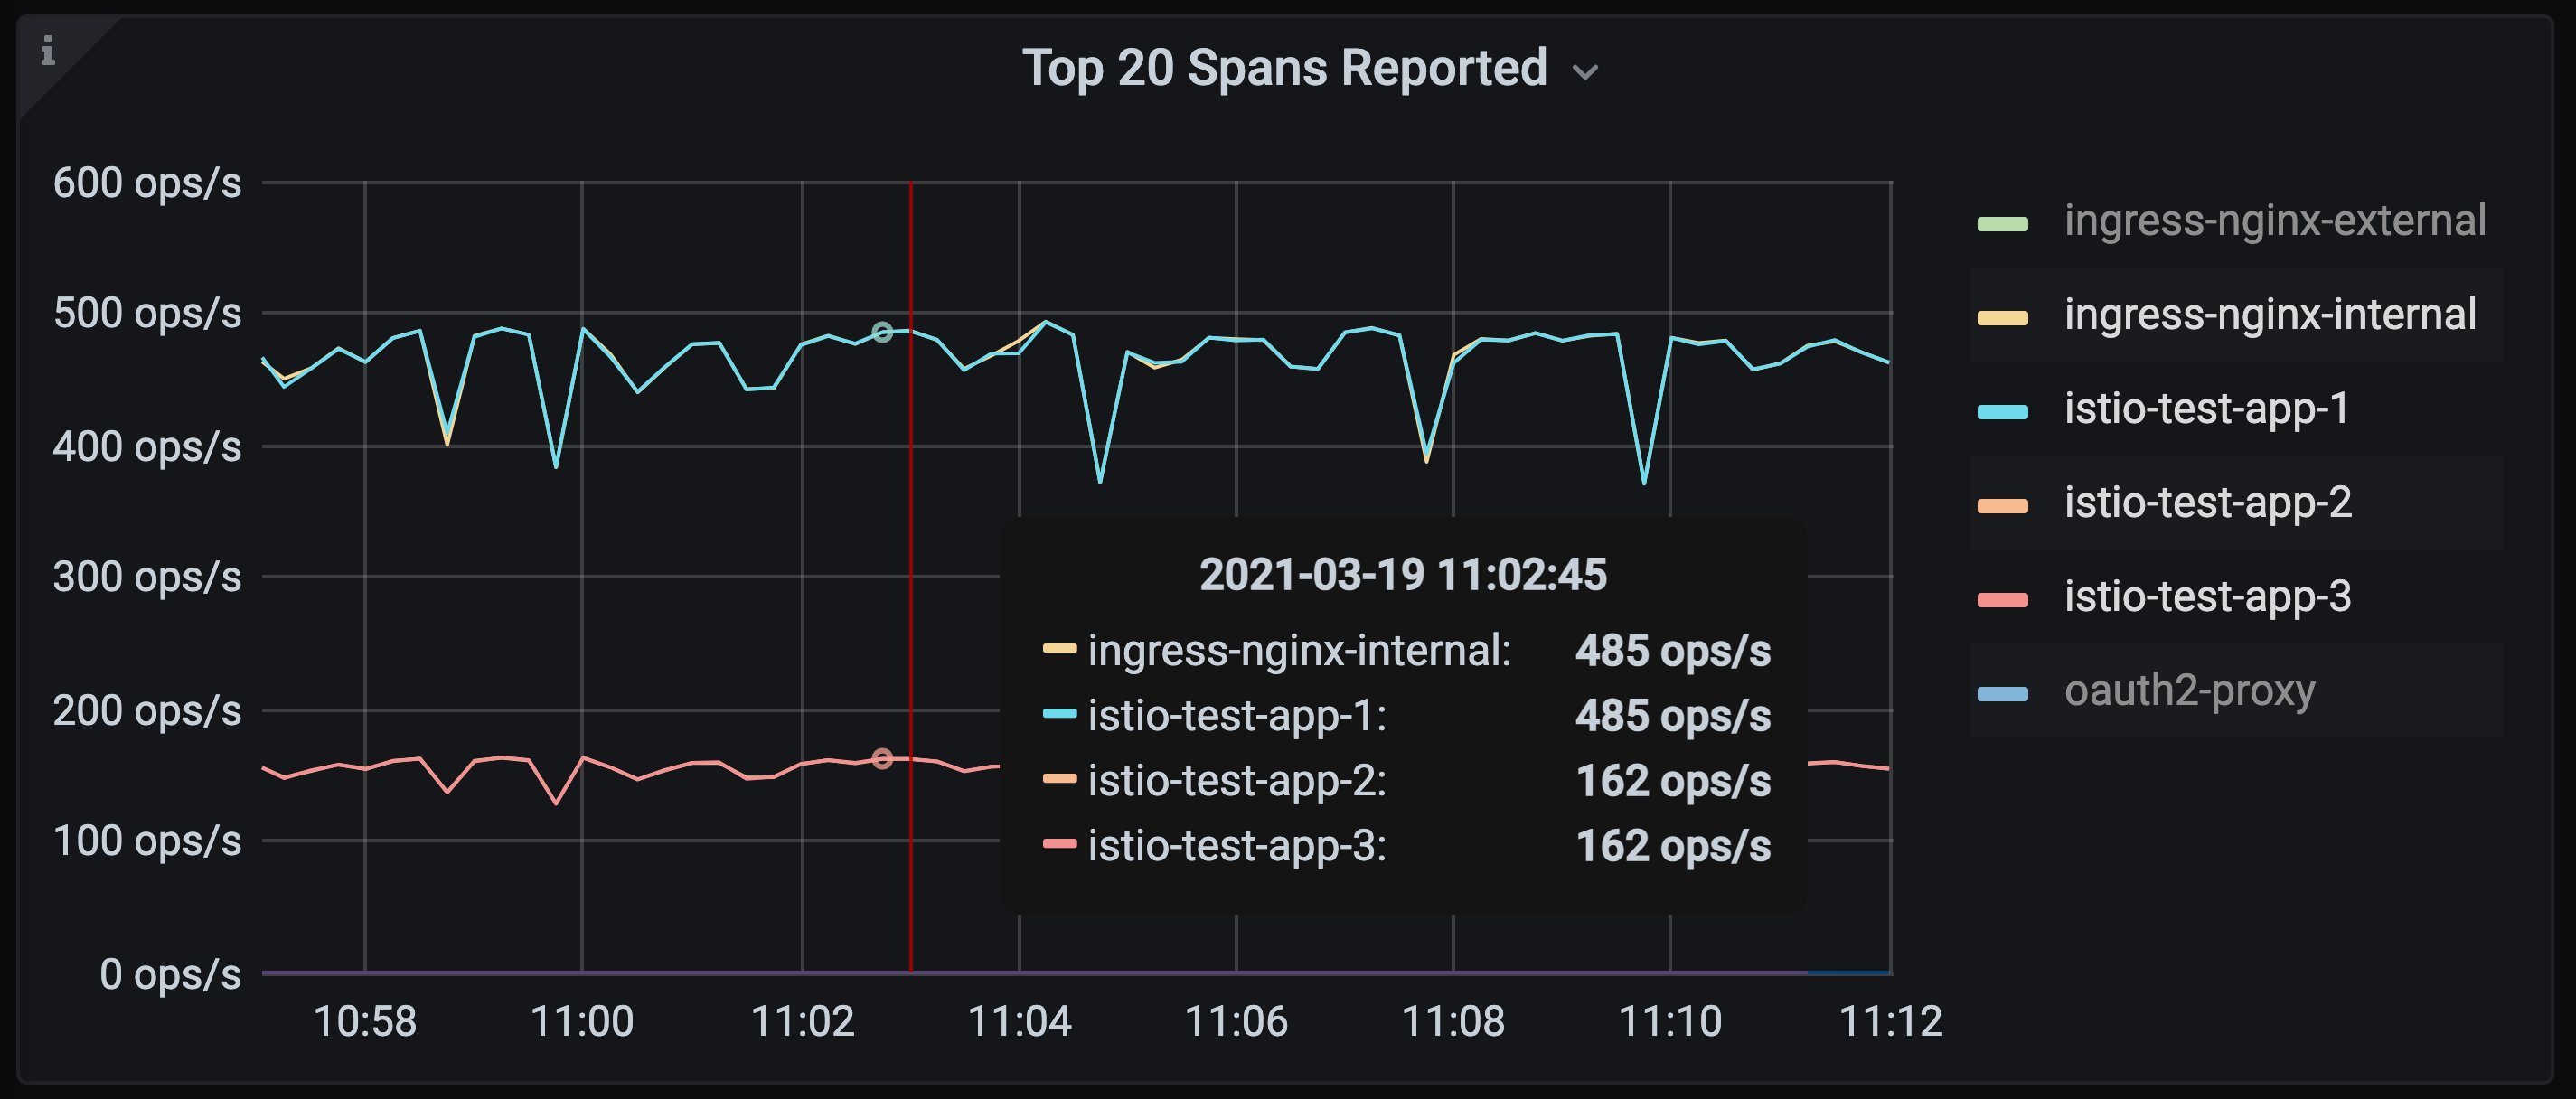
I used Apache JMeter to generate the load and configured it to send HTTP requests to the Istio test service at a rate of ~150 requests per second. This translates into approximately 1,300 ops per seconds (i.e. trace spans) being ingested by Jaeger.
Key metrics⌗
The total volume of trace spans is small compared to normal production volumes which peak at around 45,000 ops/s. In testing we run significantly fewer replicas though so this allowed me to simulate it in relative terms.
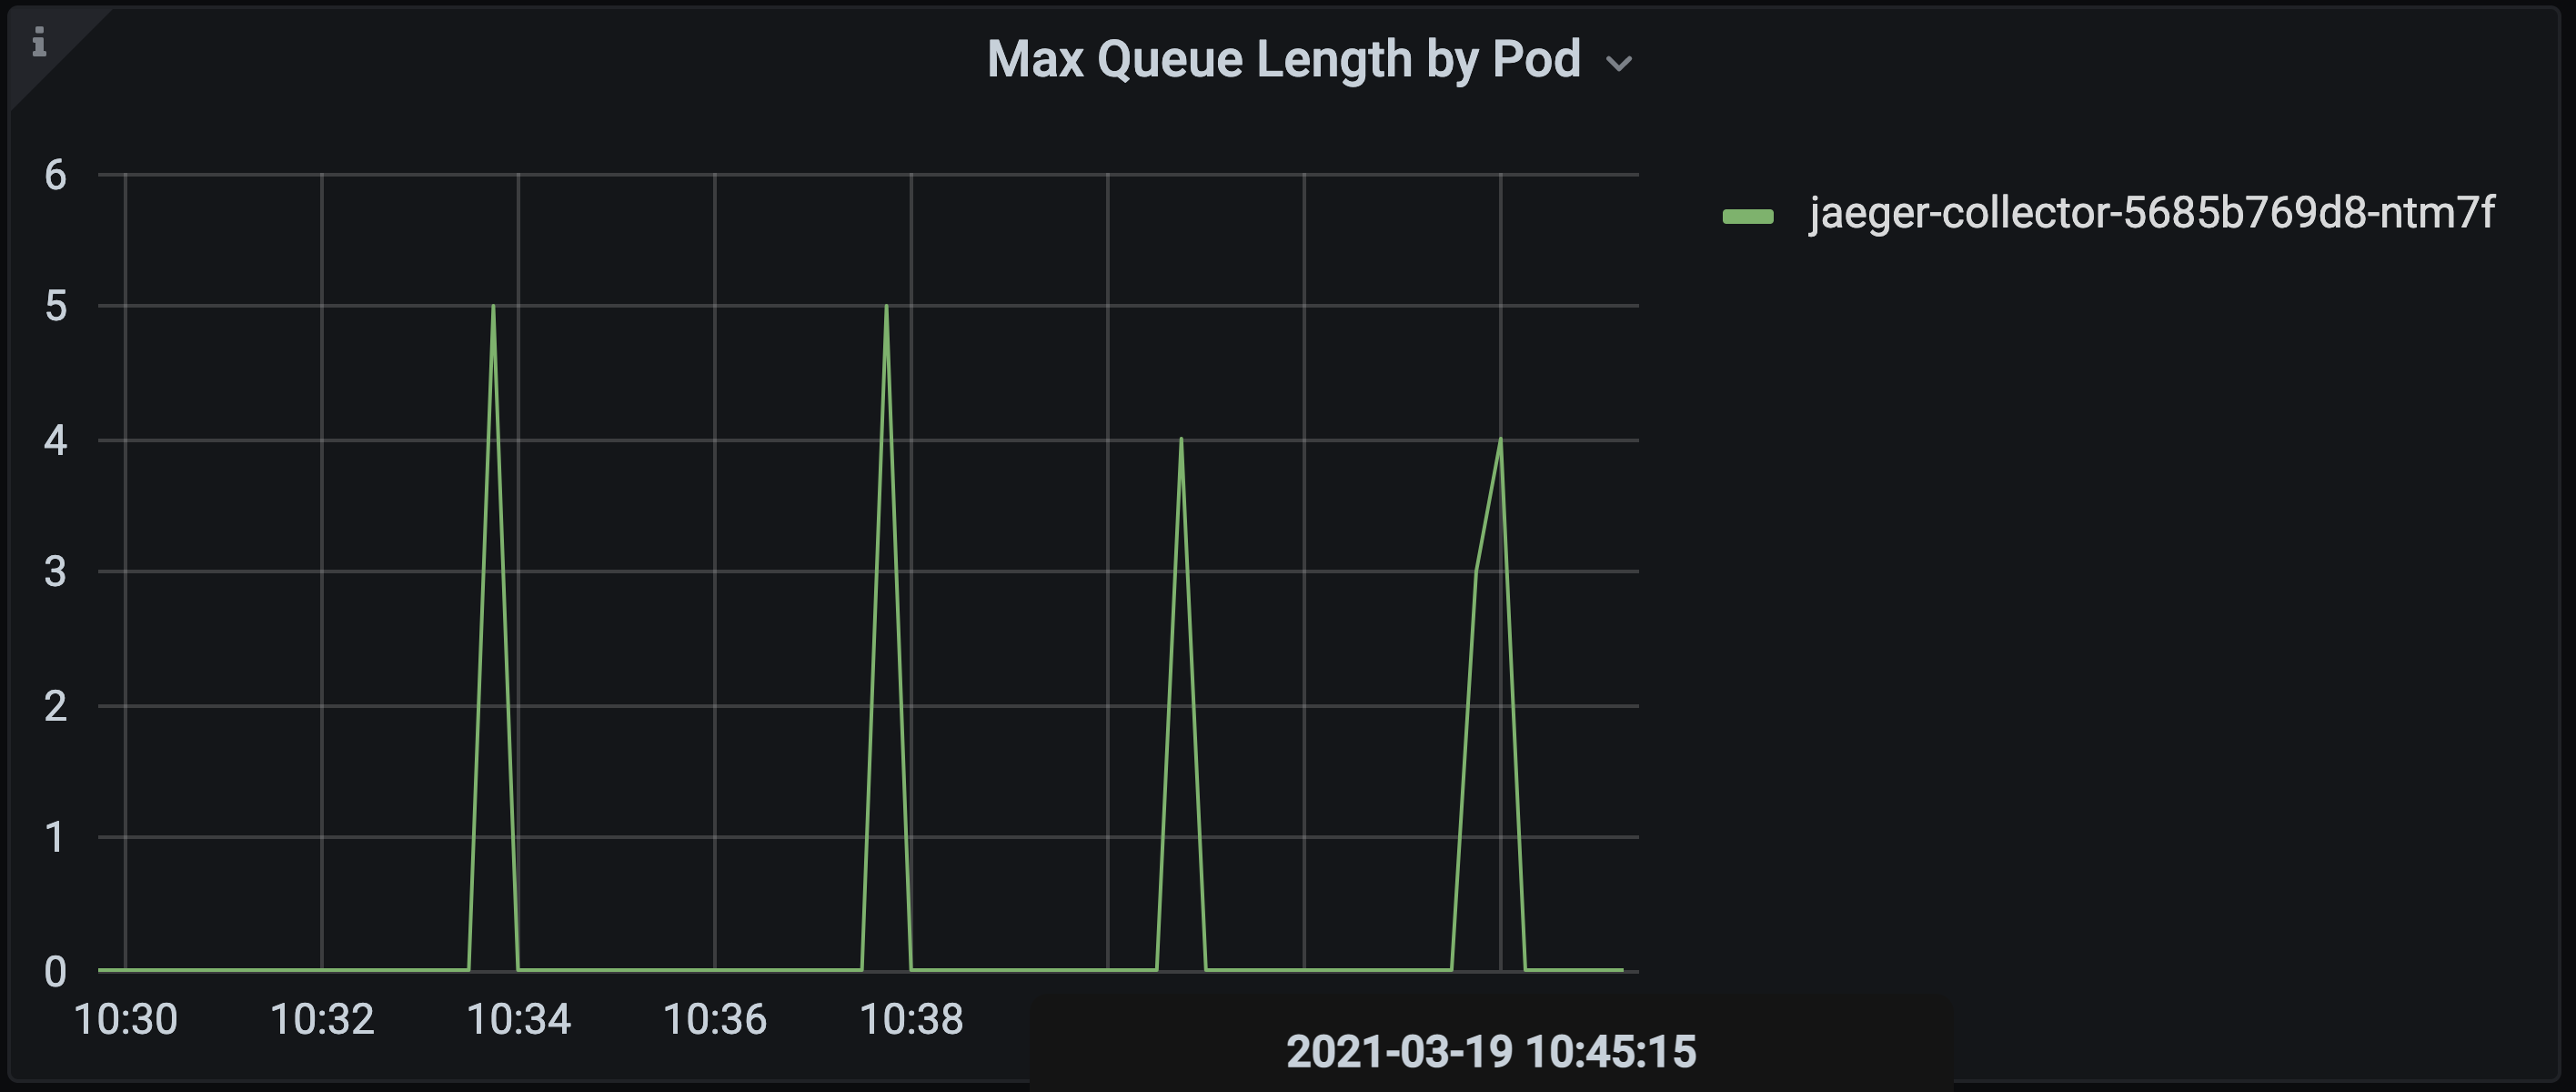
With the test load the collector queue length remains at around zero as expected i.e. as trace spans are ingested they are processed and stored in the Elasticsearch backend at the same rate.
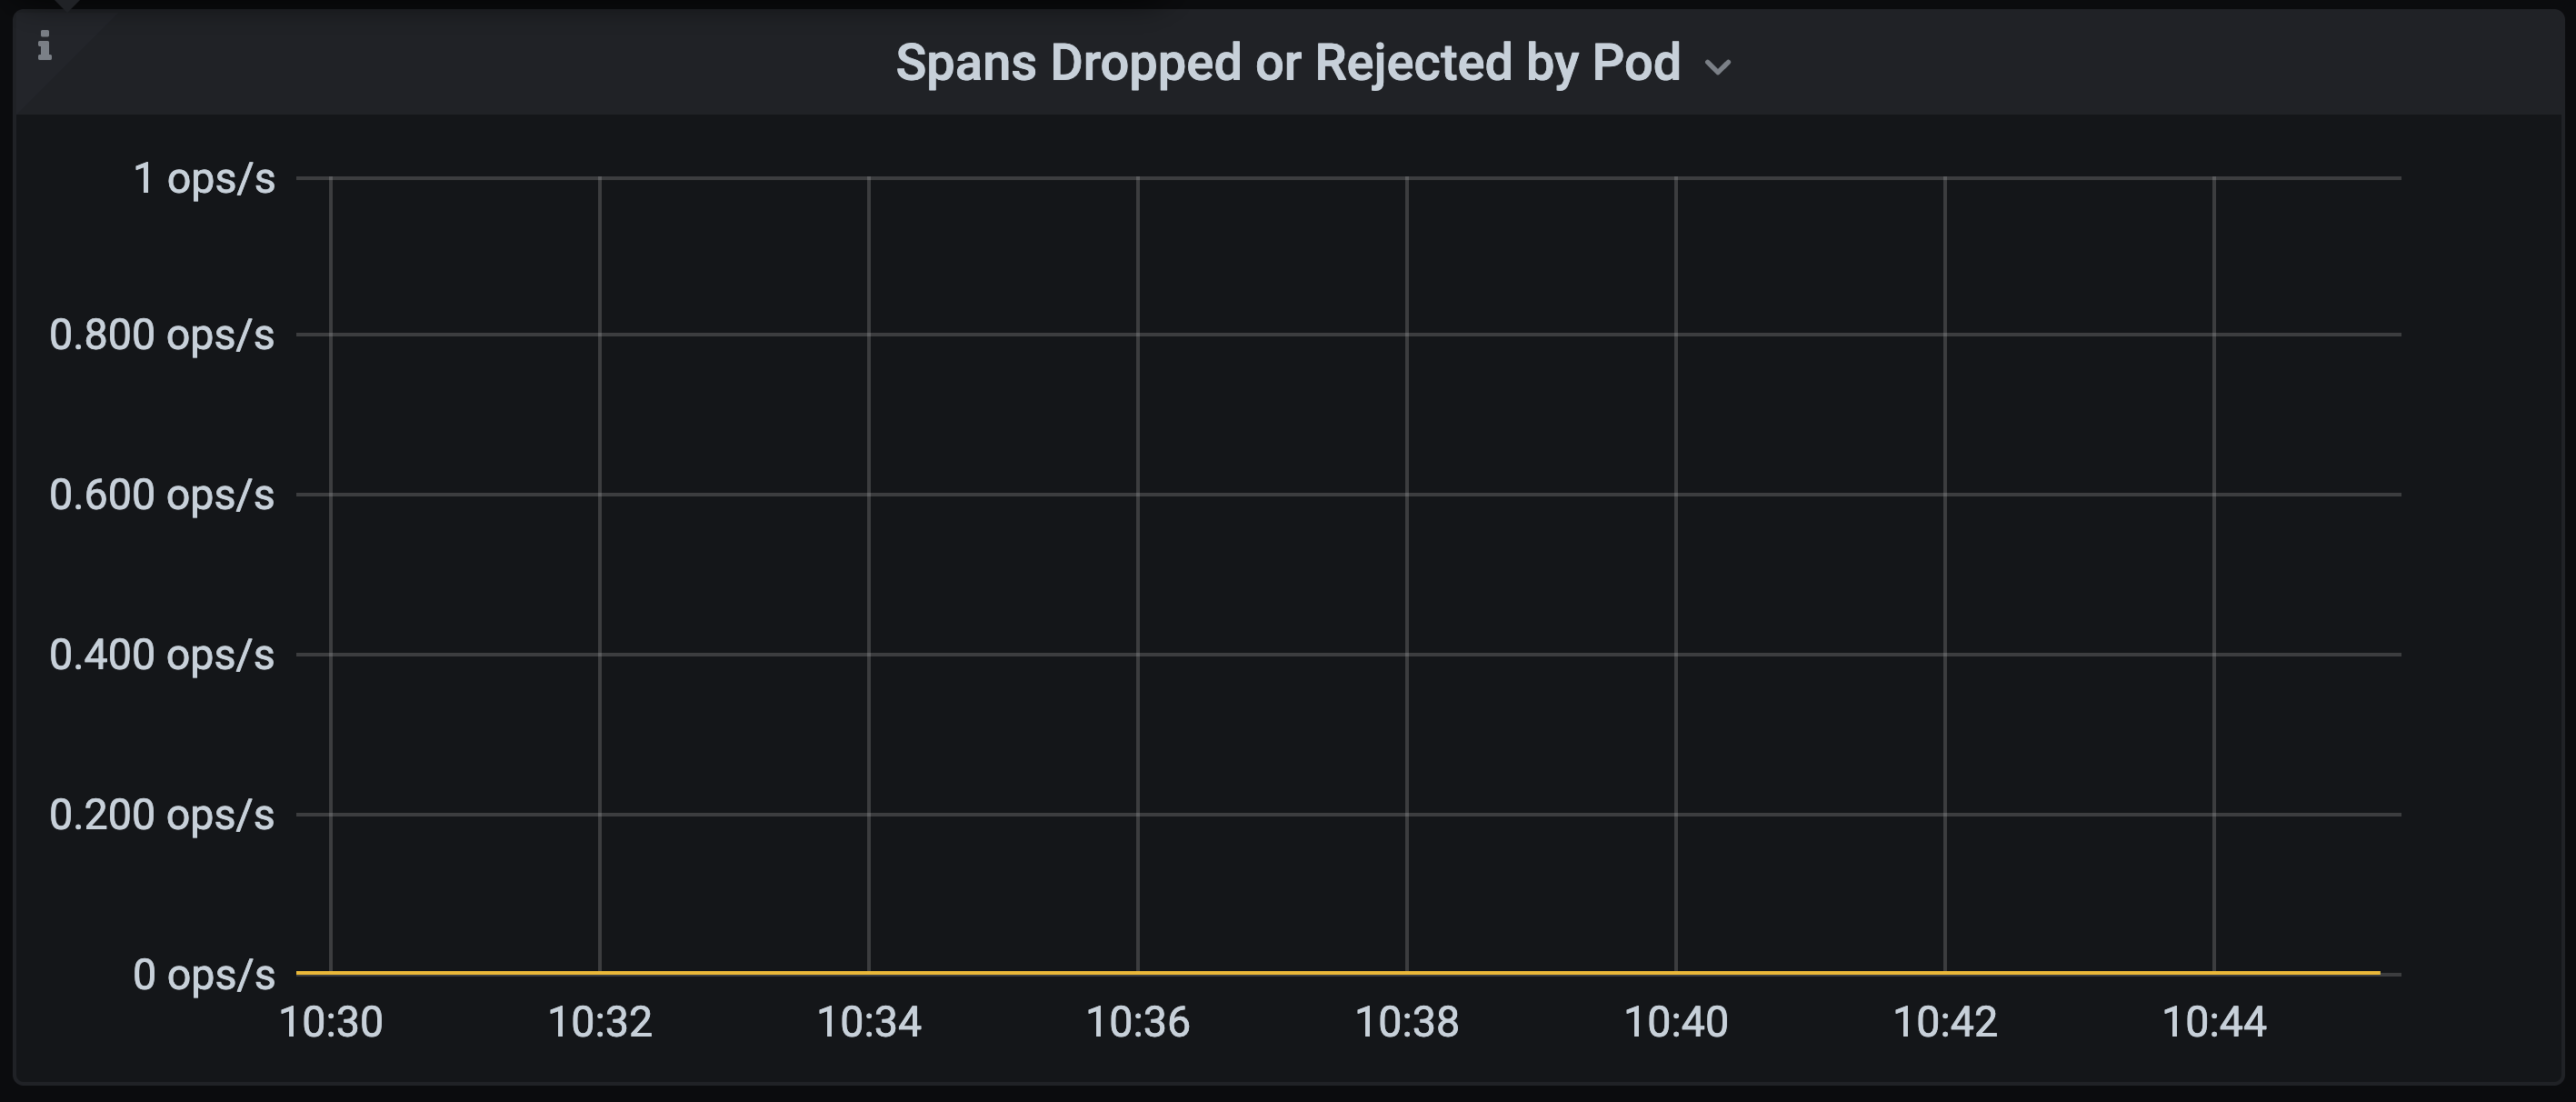
We can also observe that we are not be dropping or rejecting any spans.
However, if we break connectivity to the Elasticsearch (the storage backend) then the queue starts to fill but before we are able to observe spans being dropped the collector container is restarted by the OOM killer.
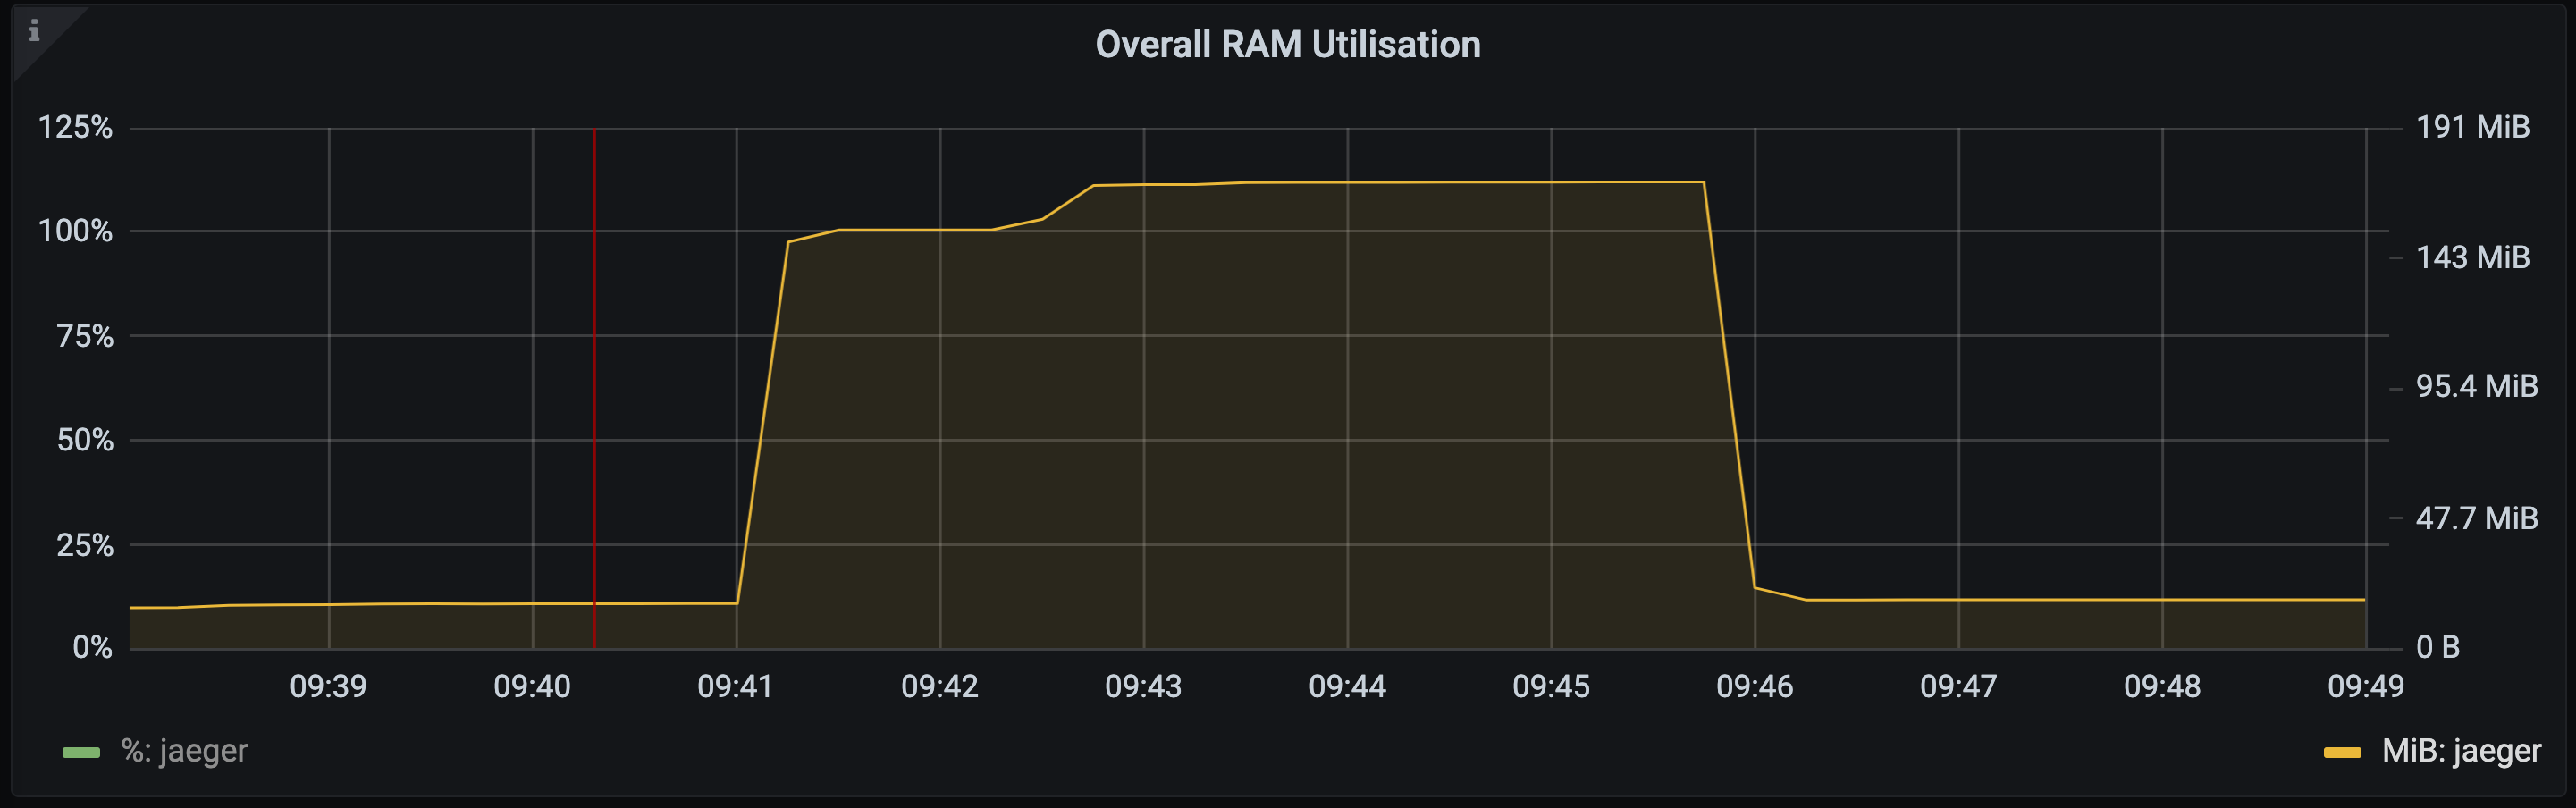
NOTE: from 09:41 to 09:46 it appears that the memory has stabilised at around 150m. This in fact just smoothing of the visualisation in Grafana due to the absence of metric data points for the period that the jaeger container was in a crash state when Prometheus was unable to perform its scrape
At this point the evidence was pointing towards items on the collector queue consuming more memory than the suggested maximum limit specified in the configuration.
Having successfully recreated the issue in a controlled environment this allowed me to experiment with potential solutions.
Solution⌗
With a better understanding that the memory used by the collector’s internal queue was not being limited as we expected it allowed me to experiment with the collector configuration to find the settings that would allow us to run the process in a predictable & resilient way.
The first idea I had in mind was to vertically scale the memory available to the collector process to understand the total memory required to run the process with our current max queue setting of 80mb.
Following a few iterations of increasing the memory request for the collector pod I found that a full queue actually requires ~750mb memory.
It should be noted that the queue size will depend on the nature of the trace spans that are collected across your services. Currently all our trace spans come from Istio and they are therefore fairly consistent is size and structure.
Rather than scale up each replica we decided to adjust the max queue setting to a size that fits within our existing memory request of 200mb. The sweet spot for this was a max queue size of 15mb.
The trade-off on this decision being a cost saving on the total resources we need to run the Jaeger collector pods against the fact that if we experience any issues causing the queue to fill up then we’ll start dropping trace spans much sooner.
Now when connectivity to the backend is broken we can see the collector’s queue fill up.
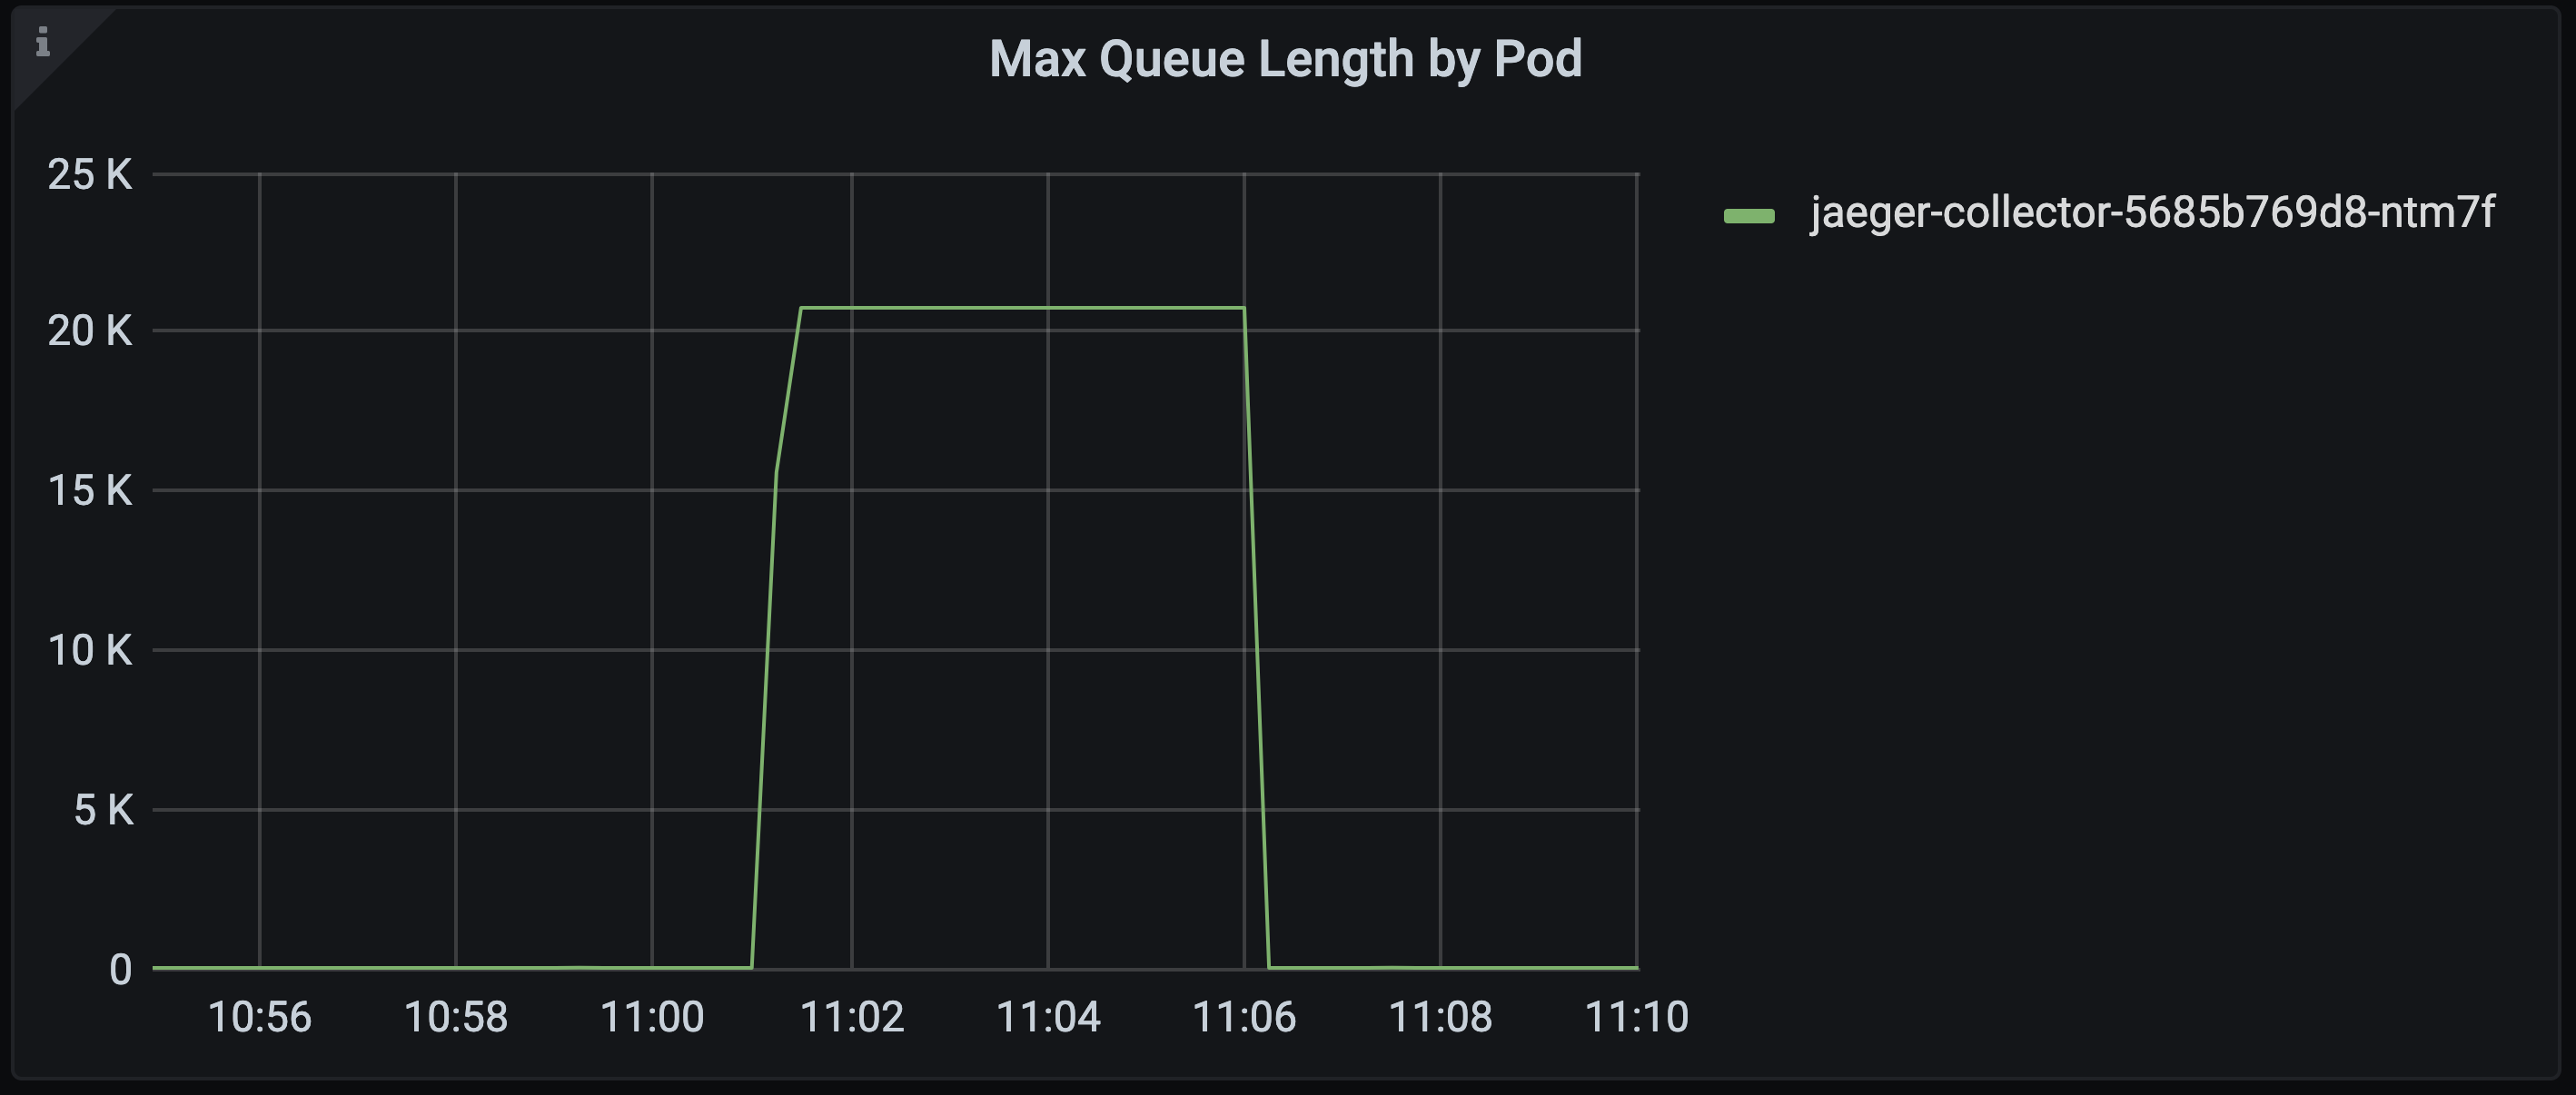
When it reached capacity we start to see spans being dropped, rather than the collector being restarted by the OOM killer.
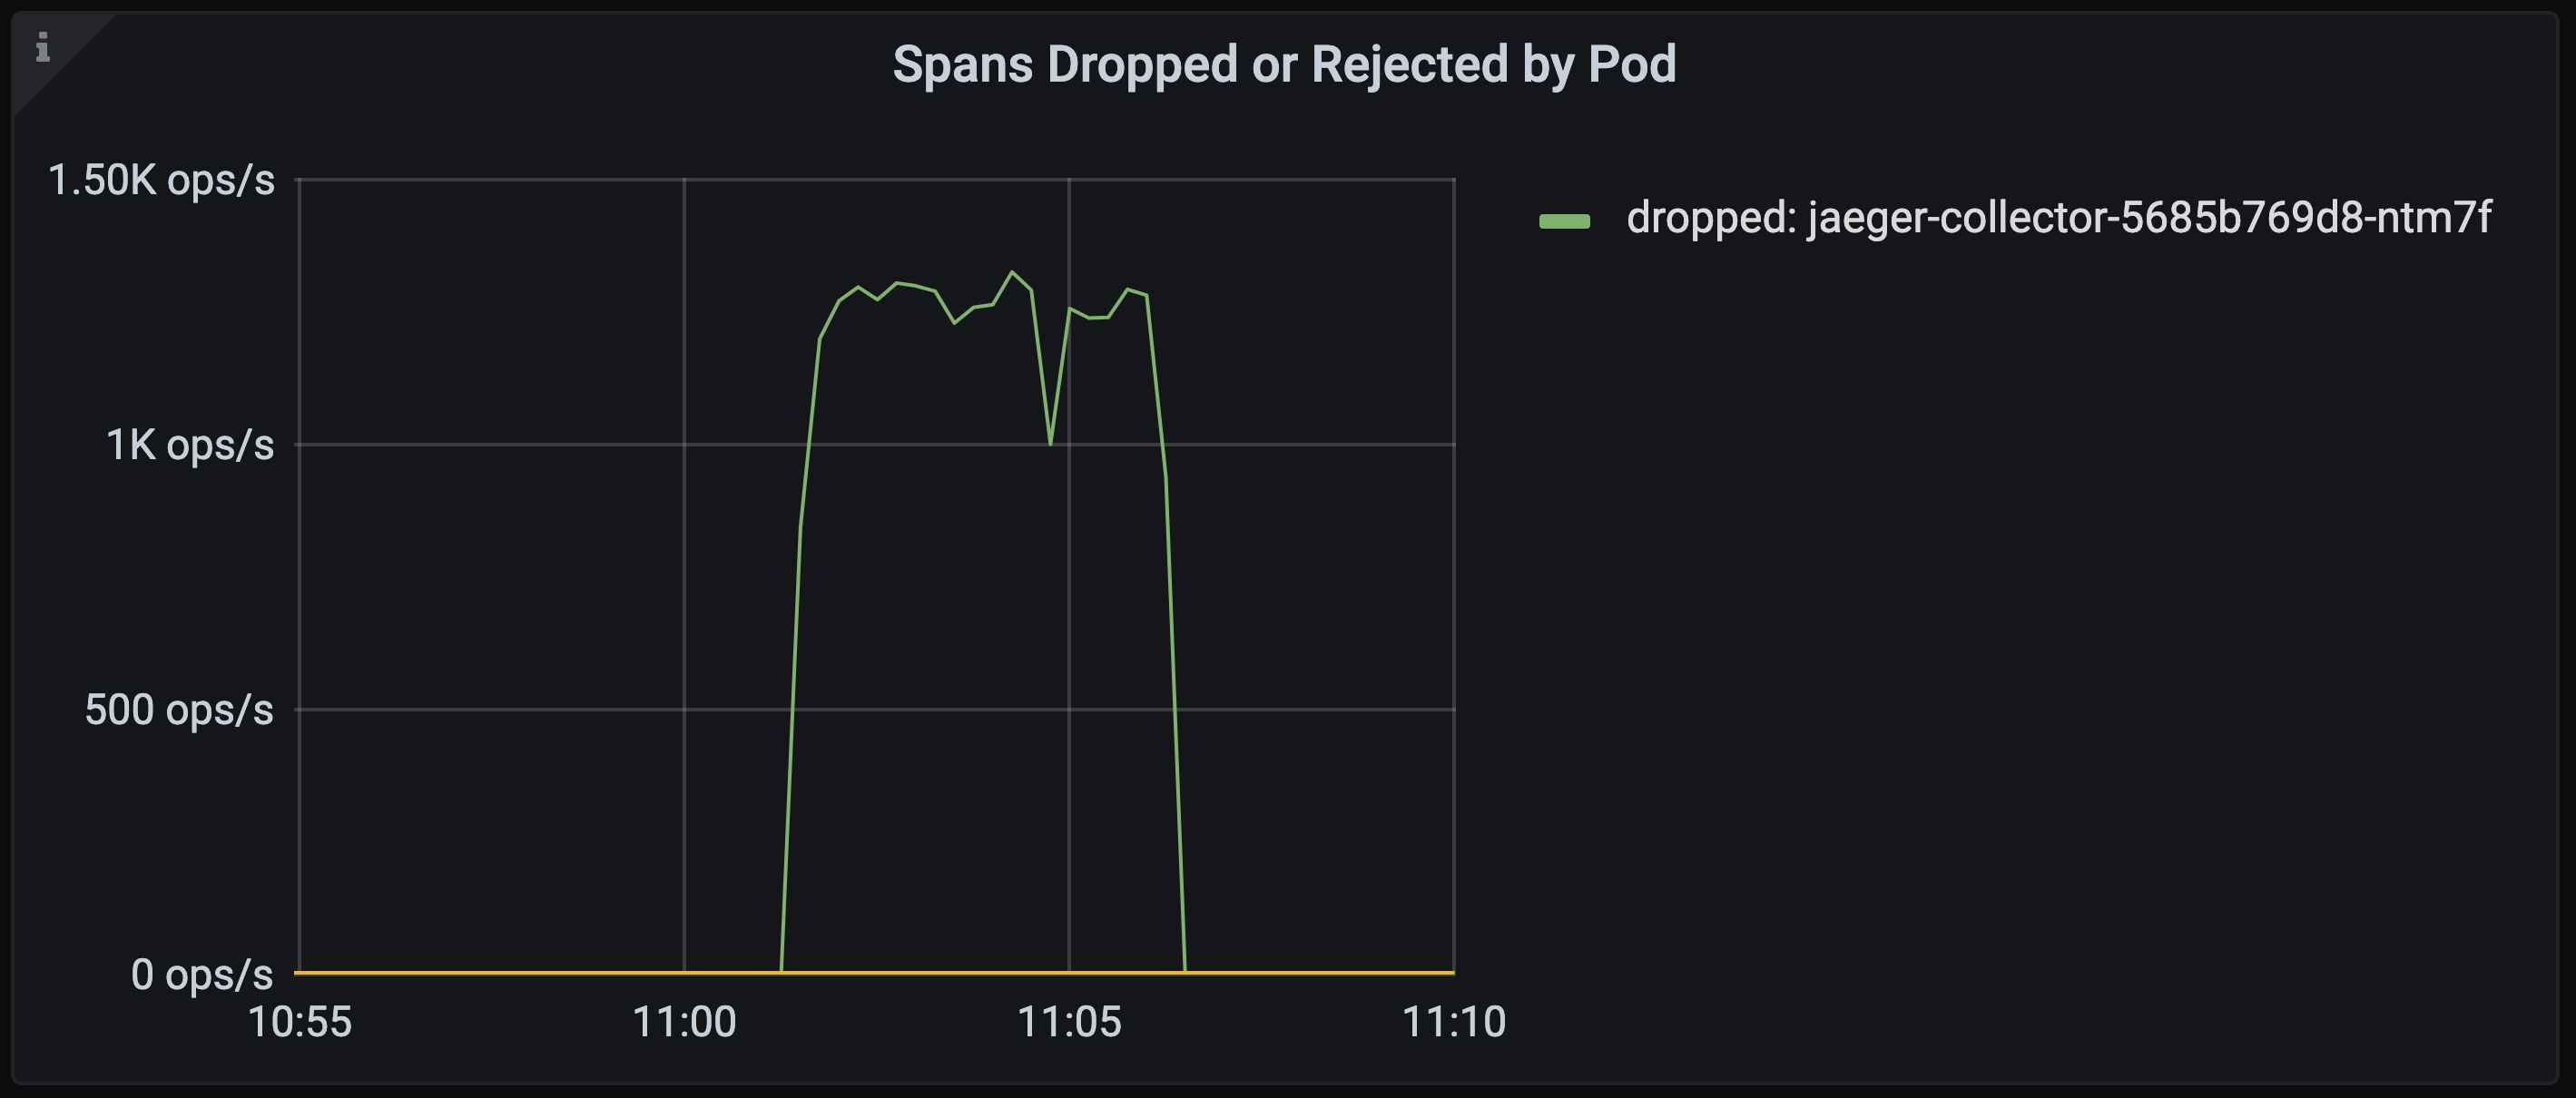
Lovely :)
Wrapping up⌗
Following this investigation we raised an issue with the Jaeger project to share our findings which they will hopefully look to investigate further and resolve.
Previous to this issue I was fairly new to Jaeger, safe to say I’ve become much more intimate with how it’s architected and some its inner workings. Often it takes a real problem for you to really grasp how a technology works.
Going forward we are now in a better position to ensure our Jaeger deployment is resilient to failure and, when the times comes, scale it to handle a larger volume of traces across the system.
References⌗
- Distributed tracing - https://microservices.io/patterns/observability/distributed-tracing.html
- Jaeger architecture - https://www.jaegertracing.io/docs/1.21/architecture/